Code
library(tidyverse)
library(readxl)
library(knitr)This post compares the University of Idaho grant awards from the department of agriculture (USDA), the department of energy (DOE), the national institute of health (NIH), and the national science foundation (NSF) to other similar universities.
library(tidyverse)
library(readxl)
library(knitr)Department of Agriculture (USDA)
This is the data set from the USDA. link here:
#USDA data (each school in different file)

#reading in the data from the files
USDAdata_UI <- read.csv("USDAtoUI.csv")  #University of Idaho
USDAdata_BSU <- read.csv("USDABSU.csv")  #Boise State University
USDAdata_ISU <- read.csv("USDAISU.csv")  #Idaho State University
USDAdata_MSU <- read.csv("USDAMSU.csv")  #Montana State University
USDAdata_UM <- read.csv("USDAUofM.csv")  #University of Montana
USDAdata_WSU <- read.csv("USDAWSU.csv")  #Washington State University

#combining all schools into one dataframe
USDAdata_all <- rbind(USDAdata_UI, USDAdata_BSU, USDAdata_ISU, USDAdata_MSU, USDAdata_UM, USDAdata_WSU)

#picking out the columns that might be useful
USDA_data_main <- USDAdata_all %>% select(Award.Date, Grant.Title, Grantee.Name, Award.Dollars, Program.Name, Program.Area.Name)

#adding column: Source: USDA
USDA_data_main$Source <- 'USDA'

#convert dates to date objects
USDA_data_main$'Award.Date' <- as.Date(USDA_data_main$'Award.Date', format = "%Y-%m-%d")

#rename columns
colnames(USDA_data_main) <- c('Award_Date', 'Grant_Title', 'Institution', 'Award_Amount', 'Program_Name', 'Program_Area_Name', 'Source')


#show table
knitr::kable(head(USDA_data_main, 4))| Award_Date | Grant_Title | Institution | Award_Amount | Program_Name | Program_Area_Name | Source |
|---|---|---|---|---|---|---|
| 2010-09-30 | N/A | SAES - UNIVERSITY OF IDAHO | 7495 | N/A | N/A | USDA |
| 2009-09-30 | N/A | SAES - UNIVERSITY OF IDAHO | 6813 | N/A | N/A | USDA |
| 2008-09-30 | N/A | SAES - UNIVERSITY OF IDAHO | 8524 | N/A | N/A | USDA |
| 2003-09-30 | N/A | SAES - UNIVERSITY OF IDAHO | 1097 | N/A | N/A | USDA |
Department of Energy (DOE)
#DOE data (for all schools)

#reading in data from file
suppressMessages(DOE_data <- read_xlsx("DOEawards.xlsx"))

#vector so i can pick out out only relevant schools
schools <- c('Regents of the University of Idaho', 'University of Montana', 'Washington State University', 'Boise State University', 'Idaho State University', 'Montana State University')

#picking out the columns that might be useful
DOE_data_main <- DOE_data %>%
  filter(Institution %in% schools) %>%
  select(Institution, PI, Status, 'Action Type', 'Start Date', 'End Date','Most Recent Award Date', 'Amount Awarded to Date', 'Amount Awarded this FY', 'Program Area')

#add column: source: DOE
DOE_data_main$Source <- 'DOE'

#convert dates to date objects
DOE_data_main$'Start Date' <- as.Date(DOE_data_main$'Start Date', format = "%m/%d/%Y")
DOE_data_main$'End Date' <- as.Date(DOE_data_main$'End Date', format = "%m/%d/%Y")
DOE_data_main$'Most Recent Award Date' <- as.Date(DOE_data_main$'Most Recent Award Date', format = "%m/%d/%Y")

#rename columns
colnames(DOE_data_main) <- c('Institution', 'PI', 'Status', 'Is_New', 'Start_Date', 'End_Date', 'Most_Recent_Award_Date', 'Amount_Awarded_to_Date', 'Amount_Awarded_this_FY', 'Program_Area_Name', 'Source')

#show table
knitr::kable(head(DOE_data_main, 4))| Institution | PI | Status | Is_New | Start_Date | End_Date | Most_Recent_Award_Date | Amount_Awarded_to_Date | Amount_Awarded_this_FY | Program_Area_Name | Source |
|---|---|---|---|---|---|---|---|---|---|---|
| Washington State University | Cheeke, Tanya | Active | New | 2022-09-01 | 2025-05-31 | 2024-02-15 | 149995 | 0 | Atmospheric System Research | DOE |
| Regents of the University of Idaho | Sammarruca, Francesca | Active | Renewal | 2021-12-01 | 2024-11-30 | 2023-12-29 | 1812000 | 145000 | Nuclear Theory | DOE |
| Washington State University | Lange, Bernd | Active | Renewal | 2023-08-15 | 2026-08-14 | 2023-09-25 | 2995804 | 0 | Physical Biosciences | DOE |
| Boise State University | Xiong, Hui (Claire) | Active | New | 2023-08-15 | 2026-08-14 | 2023-09-23 | 599992 | 0 | Materials Chemistry | DOE |
National Institutes of Health (NIH)
#NIH data (for all selected schools)
#this was grabbed from NIH API and converted to file

#reading the data from the file
NIH_data <- read_xlsx("NIH_data.xlsx")

#picking out columns that might be useful
NIH_data_main <- NIH_data %>% select(fiscal_year, award_amount, is_active, contact_pi_name, project_start_date, project_end_date, is_new, project_title, agency_code, organization.org_name) %>% mutate(across(where(is.logical), as.character))

#rename columns
colnames(NIH_data_main) <- c('Fiscal_Year', 'Award_Amount', 'Status', 'PI', 'Start_Date', 'End_Date', 'Is_New', 'Program_Name', 'Source', 'Institution')

#convert dates to date objects
NIH_data_main$'Start_Date' <- as.Date(NIH_data_main$'Start_Date', format = "%Y-%m-%dT%H:%M:%SZ")
NIH_data_main$'End_Date' <- as.Date(NIH_data_main$'End_Date', format = "%Y-%m-%dT%H:%M:%SZ")


#show table
knitr::kable(head(NIH_data_main, 4))| Fiscal_Year | Award_Amount | Status | PI | Start_Date | End_Date | Is_New | Program_Name | Source | Institution |
|---|---|---|---|---|---|---|---|---|---|
| 2024 | 586559 | TRUE | DEMELER, BORRIES | 2024-03-15 | 2025-03-14 | FALSE | Acquisition of a Beckman-Coulter Optima AUC Analytical Ultracentrifuge for the University of Montana | NIH | UNIVERSITY OF MONTANA |
| 2024 | 2354626 | TRUE | MCGUIRE, MICHELLE KAY | 2024-03-11 | 2029-01-31 | FALSE | COBRE in Nutrition and Women’s Health | NIH | UNIVERSITY OF IDAHO |
| 2024 | 461621 | TRUE | WILLIAMS, JANET E. | 2024-03-11 | 2029-01-31 | FALSE | Research Core | NIH | UNIVERSITY OF IDAHO |
| 2024 | 162320 | TRUE | CHEN, YIMIN | 2024-03-11 | 2029-01-31 | FALSE | Research Project - RPL Chen | NIH | UNIVERSITY OF IDAHO |
National Science Foundation (NSF)
#NSF data (each school in different file)
#this was grabbed from NSF API and converted to files

#reading the files
NSFdata_UI <- read_xlsx("NSF_data.xlsx")  #University of Idaho
NSFdata_BSU <- read_xlsx("NSFtoBSU.xlsx") #Boise State University
NSFdata_ISU <- read_xlsx("NSFtoISU.xlsx") #Idaho State University
NSFdata_MSU <- read_xlsx("NSFtoMSU.xlsx") #Montana State University
NSFdata_UM <- read_xlsx("NSFtoUM.xlsx")   #University of Montana
NSFdata_WSU <- read_xlsx("NSFtoWSU.xlsx") #Washington State University

#combining all schools into one dataframe
NSFdata_all <- rbind(NSFdata_UI, NSFdata_BSU, NSFdata_ISU, NSFdata_MSU, NSFdata_UM, NSFdata_WSU)

#picking out columns that might be useful
NSF_data_main <- NSFdata_all %>% select(agency, awardeeName, estimatedTotalAmt, fundsObligatedAmt, fundProgramName, pdPIName, startDate, expDate)

#rename columns
colnames(NSF_data_main) <- c('Source', 'Institution', 'Estimated_Total_Amount', 'Funds_Obligated', 'Program_Name', 'PI', 'Start_Date', 'End_Date')

#convert dates to date objects
NSF_data_main$'Start_Date' <- as.Date(NSF_data_main$'Start_Date', format = "%m/%d/%Y")
NSF_data_main$'End_Date' <- as.Date(NSF_data_main$'End_Date', format = "%m/%d/%Y")


#show table
knitr::kable(head(NSF_data_main, 4))| Source | Institution | Estimated_Total_Amount | Funds_Obligated | Program_Name | PI | Start_Date | End_Date |
|---|---|---|---|---|---|---|---|
| NSF | Regents of the University of Idaho | 628415.00 | 628415 | Campus Cyberinfrastructure | Daniel R Ewart | 2024-04-01 | 2026-03-31 |
| NSF | Regents of the University of Idaho | 456051.00 | 302462 | UNDERGRADUATE PROGRAMS IN CHEM | Kristopher V Waynant | 2024-04-01 | 2027-03-31 |
| NSF | Regents of the University of Idaho | 1000000.00 | 1000000 | NSF Engines - Type 1 | Tara Hudiburg | 2024-03-01 | 2025-08-31 |
| NSF | Regents of the University of Idaho | 1179977.00 | 546482 | Discovery Research K-12 | Julie M Amador | 2023-12-01 | 2027-11-30 |
The Combined Data
#combining all the data sets together
combined_data <- bind_rows(USDA_data_main, DOE_data_main, NIH_data_main, NSF_data_main)

#show table
knitr::kable(head(combined_data, 4))| Award_Date | Grant_Title | Institution | Award_Amount | Program_Name | Program_Area_Name | Source | PI | Status | Is_New | Start_Date | End_Date | Most_Recent_Award_Date | Amount_Awarded_to_Date | Amount_Awarded_this_FY | Fiscal_Year | Estimated_Total_Amount | Funds_Obligated |
|---|---|---|---|---|---|---|---|---|---|---|---|---|---|---|---|---|---|
| 2010-09-30 | N/A | SAES - UNIVERSITY OF IDAHO | 7495 | N/A | N/A | USDA | NA | NA | NA | NA | NA | NA | NA | NA | NA | NA | NA |
| 2009-09-30 | N/A | SAES - UNIVERSITY OF IDAHO | 6813 | N/A | N/A | USDA | NA | NA | NA | NA | NA | NA | NA | NA | NA | NA | NA |
| 2008-09-30 | N/A | SAES - UNIVERSITY OF IDAHO | 8524 | N/A | N/A | USDA | NA | NA | NA | NA | NA | NA | NA | NA | NA | NA | NA |
| 2003-09-30 | N/A | SAES - UNIVERSITY OF IDAHO | 1097 | N/A | N/A | USDA | NA | NA | NA | NA | NA | NA | NA | NA | NA | NA | NA |
In this section we’ll look at the following question:
Provide a visualization that shows our active awards from each sponsor. I need to see their start date and end date, the amount of the award, and the name of the Principal Investigator. I’m really interested in seeing how far into the future our current portfolio will exist. Are there a bunch of awards about to expire? Are there a bunch that just got funded and will be active for a while? Does this vary across sponsors?
#Overview of award amount per agency for active awards

#filtering the data
#Note: for the USDA I have to estimate what should be counted as current
try({

Question_1_1_USDA <- USDA_data_main %>%
  filter(grepl("UNIVERSITY OF IDAHO", Institution)) %>%
  filter(Award_Date > '2023-06-01') %>%
  select('Award_Amount', 'Source', 'Institution', 'Award_Date')

colnames(Question_1_1_USDA) <- c("Amount", "Source", "Institution", "Date")

Question_1_1_DOE <- DOE_data_main %>%
  filter(grepl("UNIVERSITY OF IDAHO", Institution)) %>%
  filter(Status == "Active") %>%
  select('Amount_Awarded_this_FY', 'Source', 'Institution', 'End_Date')

colnames(Question_1_1_DOE) <- c("Amount", "Source", "Institution", "Date")

Question_1_1_NIH <- NIH_data_main %>%
  filter(grepl("UNIVERSITY OF IDAHO", Institution)) %>%
  filter(Status == TRUE) %>%
  select('Award_Amount', 'Source', 'Institution', 'End_Date')

colnames(Question_1_1_NIH) <- c("Amount", "Source", "Institution", "Date")

#Note: I might want to use funds obligated instead?
Question_1_1_NSF <- NSF_data_main %>%
  filter(Institution == "Regents of the University of Idaho") %>%
  filter(End_Date > '2024-01-01') %>%
  select('Estimated_Total_Amount', 'Source', 'Institution', "End_Date") %>%
  mutate(Estimated_Total_Amount = as.numeric(Estimated_Total_Amount))

colnames(Question_1_1_NSF) <- c("Amount", "Source", "Institution", "Date")

Question_1_1 <- rbind(Question_1_1_USDA, Question_1_1_DOE, Question_1_1_NIH, Question_1_1_NSF)
}, silent = FALSE)

################  Making the Graph  ################

# sum award money
Question_1_1$Amount <- as.numeric(Question_1_1$Amount)

Award_money_by_source <- Question_1_1 %>%
  group_by(Source) %>%
  summarise(TotalAmount = sum(Amount))

# Create bar graph
ggplot(Award_money_by_source, aes(x = Source, y = TotalAmount / 1e6, fill = Source)) +
  geom_bar(stat = "identity") +
  labs(title = "Total Award Money per Agency for Active Awards",
       x = "",
       y = "Total Award Money (million)") +
  geom_text(aes(label = round(TotalAmount/1e6, digits = 1), vjust = -0.5)) +
  theme_minimal()
Figure 1. This graph shows a comparison of total award money for active awards per agency. Note that for NSF, NIH, and DOE awards were considered active if they were labeled as such and for the USDA any award with an award date after April 1st 2023 was considered active.
(or at least that will be what this graph is when i figure out how to actually make the filter by dates work… )
#Gantt graph to look at PIs

#what my plan was:
# a graph showing pi on vertical axis sorted by amount awarded (highest amount top), with bars representing start and end dates, color coded based on source (NIH, NSF, DOE, or USDA). and set up with a fixed size and bar spacing with a scroll bar for readability if possible. Note: I should only show active so filter by that. Note: USDA will not be able to be included because of lack of start and end dates/ is active tag. Note: DOE will not be included because there are no active awards.

######################################

# NIH awards timeline by PI

#Sorting NIH data
Q1_2_NIH <- NIH_data_main %>%
  filter(grepl("UNIVERSITY OF IDAHO", Institution)) %>%
  filter(Status == TRUE) %>%
  group_by(PI) %>%
  reframe(amount = sum(Award_Amount), Start_Date, End_Date)

#Making the graph
ggplot(Q1_2_NIH, aes(x = Start_Date, xend = End_Date, y = reorder(PI, +amount), yend = PI)) +
  geom_segment(linewidth = 5, color = "violet") +
  scale_x_date(date_breaks = "1 year", date_labels = "%Y") +
  labs(title = "NIH Active Awards Timeline for PI",
       x = "Year",
       y = "Principal Investigator") +
  geom_text(aes(label =  amount), hjust = -1, color = "black") +
  theme_minimal()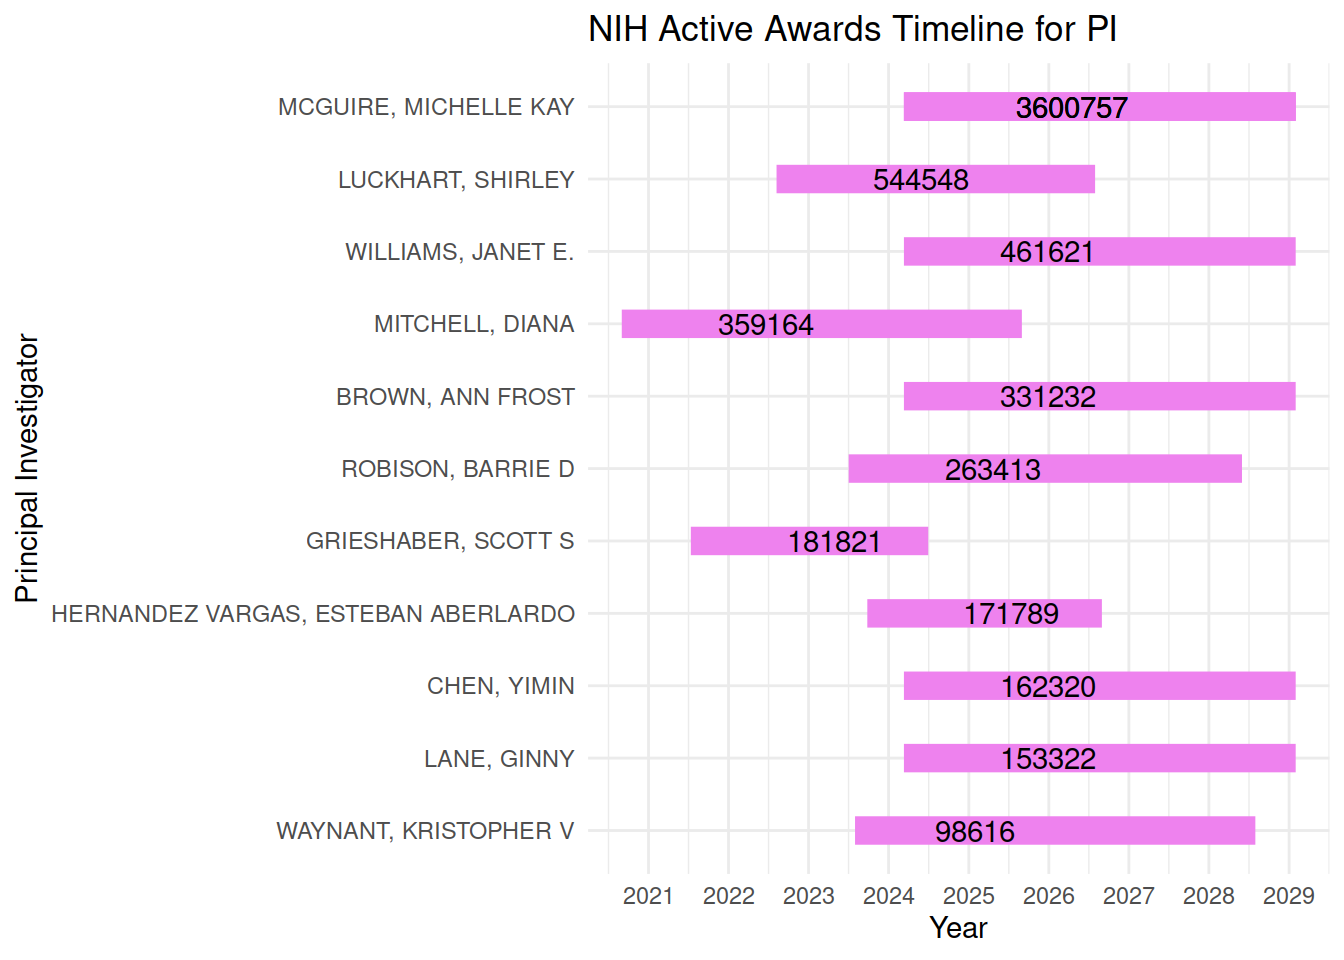
# NSF awards timeline by PI

#Sorting the NSF data
Q1_2_NSF <- NSF_data_main %>%
  filter(grepl("University of Idaho", Institution)) %>%
  filter(End_Date > '2024-01-01') %>%
  mutate(Estimated_Total_Amount = as.numeric(Estimated_Total_Amount)) %>%
  group_by(PI) %>%
  reframe(amount = sum(Estimated_Total_Amount), Start = min(Start_Date), End = max(End_Date))

#Making the graph
ggplot(Q1_2_NSF, aes(x = Start, xend = End, y = reorder(PI, +amount), yend = PI)) +
  geom_segment(linewidth = 2, color = "lightgreen") +
  scale_x_date(date_breaks = "1 year", date_labels = "%Y") +
  labs(title = "NSF Active Awards Timeline for PI",
       x = "Year",
       y = "Principal Investigator") +
  geom_text(aes(label =  amount), hjust = -1, color = "black") +
  theme_minimal()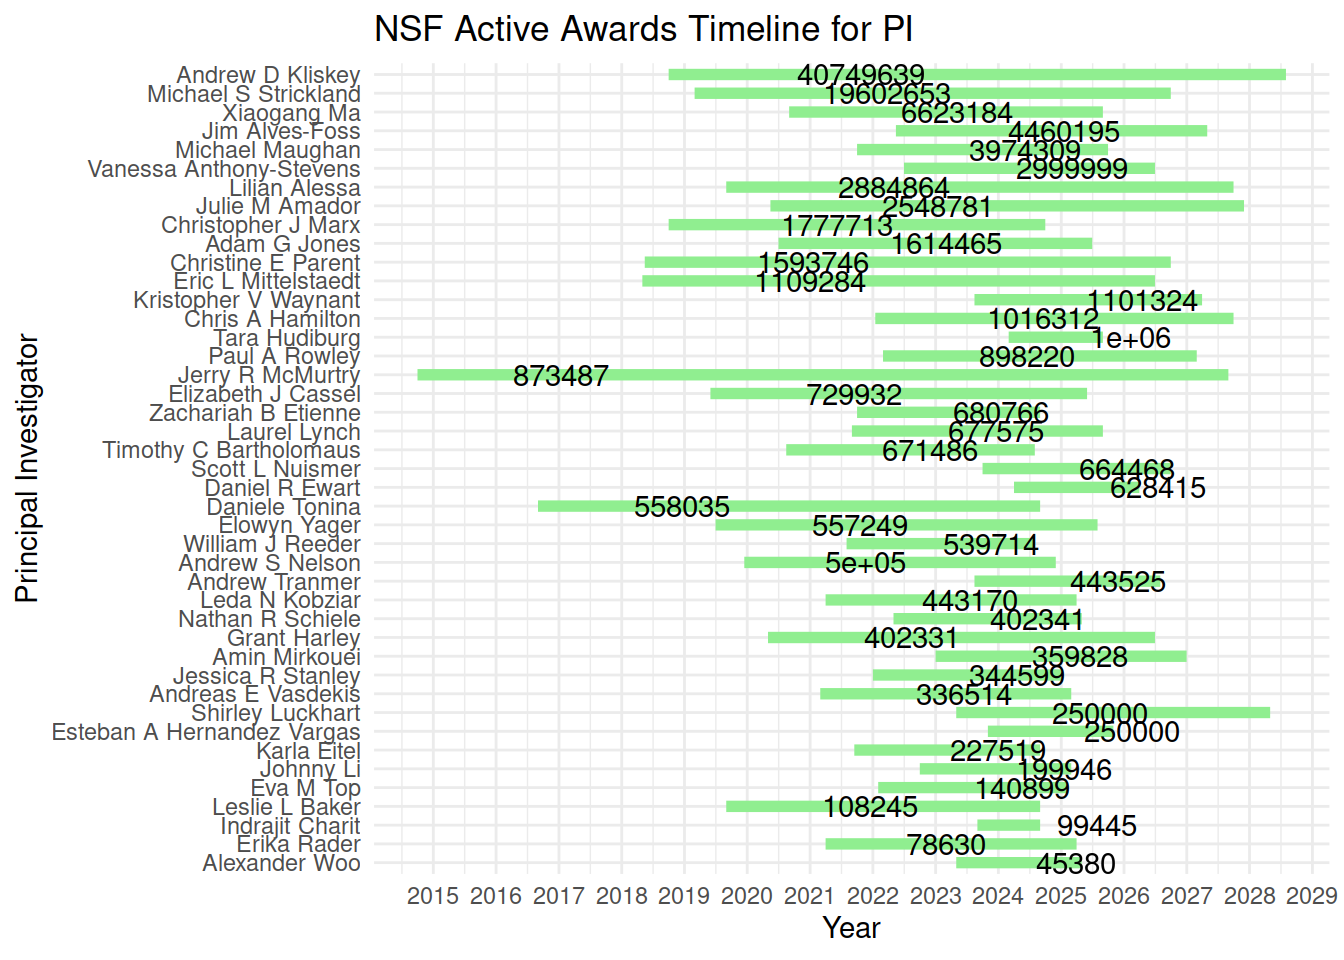
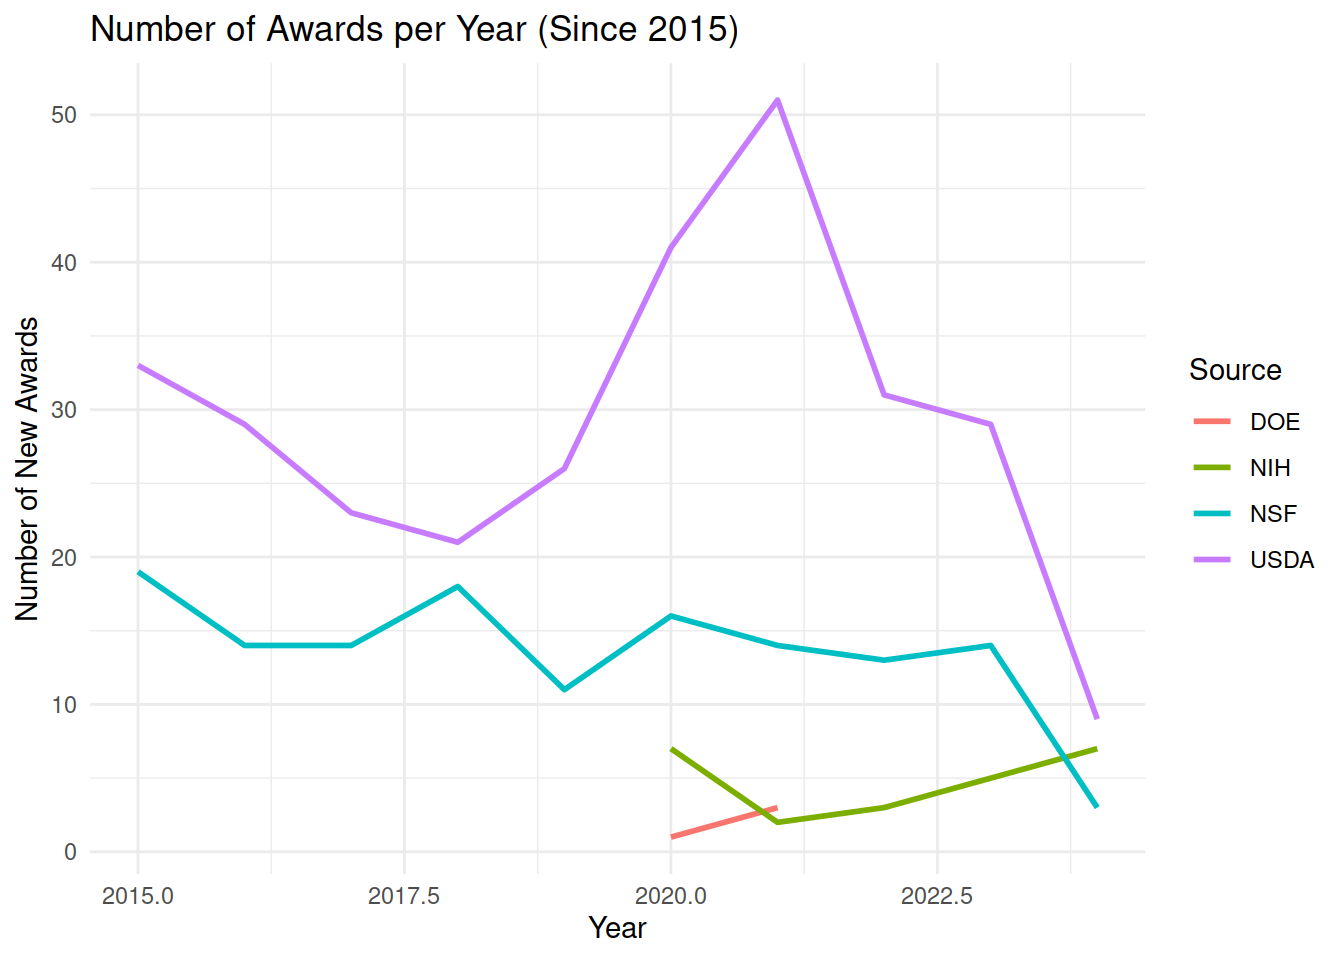
What is the proportional representation of new awards to the UI from these various sources over the past 5 to 10 years? Are there any trends that are encouraging or discouraging?
#Trends over time

# a graph showing the number of new awards from each source (or just awards in the case of USDA) vs time, with a different line for each source.
# a graph showing the amount of money per new awards vs. time for each source.

suppressWarnings({
  suppressMessages({

# Pick out group based on USDA: awards by date
Q2_1_USDA <- USDA_data_main %>%
  filter(grepl("UNIVERSITY OF IDAHO", Institution)) %>%
  mutate( Award_Date = as.integer(format(Award_Date, "%Y"))) %>%
  select(Award_Date, Institution, Source)

# pick out group based on everything else: awards by start date
Q2_1_Other <- combined_data %>%
  filter(grepl("UNIVERSITY OF IDAHO", Institution, ignore.case = TRUE)) %>%
  filter(Source %in% c("NIH", "NSF", "DOE")) %>%
  mutate(Start_Date = as.integer(format(Start_Date, "%Y"))) %>%
  select(Start_Date, Institution, Source) %>%
  rename(Award_Date = Start_Date)

#combined everything and grouping it for graph
Q2_1 <- rbind(Q2_1_USDA, Q2_1_Other) %>%
  filter(Award_Date >= 2015) %>%
  group_by(Award_Date, Source) %>%
  summarise(count = n(), Source)

#Making the graph
ggplot(Q2_1, aes(x = Award_Date , y = count, color = Source)) +
  geom_line(size = 1) +
  #scale_color_manual(values = c()) +
  #scale_linetype_manual(values = c()) +
  labs(title = "Number of Awards per Year (Since 2015)",
       x = "Year",
       y = "Number of New Awards") +
    theme_minimal()

})
})
In this section we’ll compare the University of Idaho to some other schools.
# a graph showing a comparison of awards (or award money) given to each school by source. so a clump showing the number of awards (or amount of money) from for example from the NSF for each school then another clump for NIH, etc. Color coded by school for visibility across clumps. Note: active awards only. For the USDA awards use date = 2024

# need to organize data so that the different versions of the schools are all sorted together. so things are grouped based on if each school name is grouped together. I also may need to worry about dates in the different groups, although i do think i need to work with the dates in the above section convert dates

suppressMessages({

#Grouping data by school and filtering by date and agency
Q3_1 <- combined_data %>%
  filter(Source %in% c("NIH", "NSF", "USDA", "DOE")) %>%
  filter(Award_Date > '2010-01-01' | Start_Date > '2010-01-01') %>%
  mutate(category = case_when(
      grepl("University of Idaho", Institution, ignore.case = TRUE) ~ "University of Idaho",
      grepl("Boise State University", Institution, ignore.case = TRUE) ~ "Boise State University",
      grepl("Idaho State University", Institution, ignore.case = TRUE) ~ "Idaho State University",
      grepl("Montana State University", Institution, ignore.case = TRUE) ~ "Montana State University",
      grepl("University of Montana", Institution, ignore.case = TRUE) ~ "University of Montana",
      grepl("Washington State University", Institution, ignore.case = TRUE) ~ "Washington State University",
      #TRUE ~ "Other"
      )
  ) %>%
  group_by(category, Source) %>%
    summarise(awards_count = n())
})

#Picking out colors for bars
institution_colors <- c("University of Idaho" = "gold", "Boise State University" = "salmon", "Idaho State University" = "skyblue", "Montana State University" = "forestgreen",  "University of Montana" = "violet",  "Washington State University" = "brown")


#Making the graph
ggplot(Q3_1, aes(x = Source, y = awards_count, fill = category)) +
  geom_bar(stat="identity", position = "dodge") +
  scale_fill_manual(values = institution_colors, name = "School") +
  labs(title = "Number of Awards Per School (After Jan 1 2010)",
       x = "",
       y = "Number of Awards") +
    theme_minimal()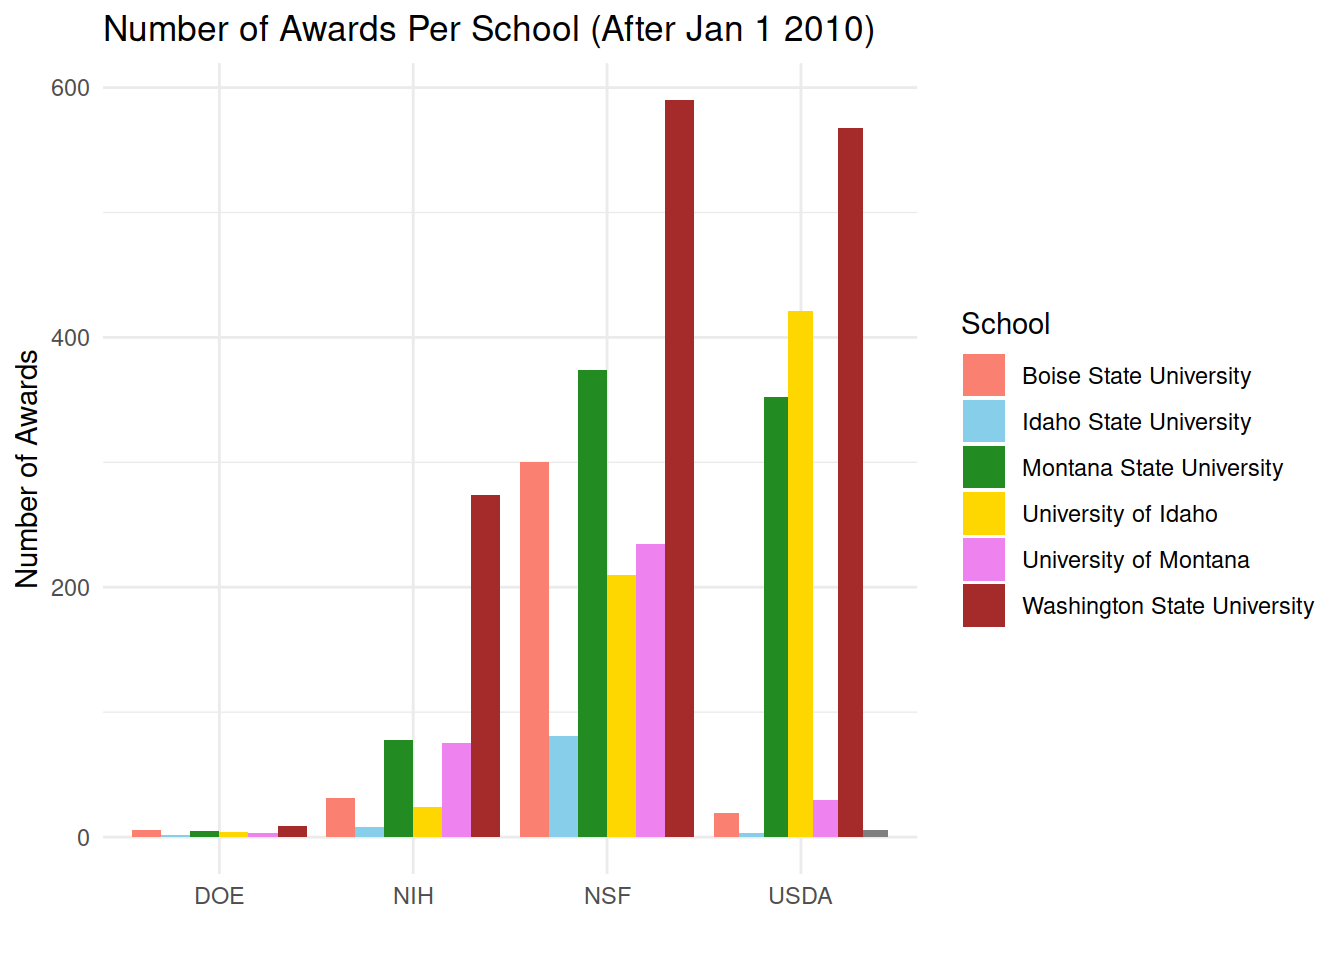
Figure ?. Comparing the number of awards for each school across the whole data set
#comparing the schools to each other

# a graph comparing trends for each school (are any downturns coming for all the schools?). color coded and shape coded to clump schools, and sources. Colors for schools, shapes for sources, e.g. solid lines for NSF, rect dash for NIH, triangles dash for DOE, dots dash for USDA.

suppressWarnings({
  suppressMessages({

# Pick out group based on USDA: awards by date
Q3_1_USDA <- USDA_data_main %>%
  mutate( Award_Date = as.integer(format(Award_Date, "%Y"))) %>%
  select(Award_Date, Institution, Source)

# pick out group based on everything else: awards by start date
Q3_1_Other <- combined_data %>%
  filter(Source %in% c("NIH", "NSF", "DOE")) %>%
  mutate(Start_Date = as.integer(format(Start_Date, "%Y"))) %>%
  select(Start_Date, Institution, Source) %>%
  rename(Award_Date = Start_Date)

#combined everything and grouping it for graph
Q3_1 <- rbind(Q3_1_USDA, Q3_1_Other) %>%
  filter(Award_Date >= 2015) %>%
   mutate(school = case_when(
      grepl("University of Idaho", Institution, ignore.case = TRUE) ~ "University of Idaho",
      grepl("Boise State University", Institution, ignore.case = TRUE) ~ "Boise State University",
      grepl("Idaho State University", Institution, ignore.case = TRUE) ~ "Idaho State University",
      grepl("Montana State University", Institution, ignore.case = TRUE) ~ "Montana State University",
      grepl("University of Montana", Institution, ignore.case = TRUE) ~ "University of Montana",
      grepl("Washington State University", Institution, ignore.case = TRUE) ~ "Washington State University")) %>%
  group_by(Award_Date, Source, school) %>%
  summarise(count = n(), Source, school)

# Agency Lines
agency_marks <- c('DOE' = 'dotdash', 'NIH' = 'dashed', 'NSF' = 'solid', 'USDA' = 'dotted')

#Making the graph
ggplot(Q3_1, aes(x = Award_Date , y = count, color = school, linetype = Source)) +
  geom_line(size = 1) +
  scale_color_manual(values = institution_colors, name = 'School') +
  scale_linetype_manual(values = agency_marks, name = 'Agency') +
  labs(title = "Number of Awards per Year (Since 2015)",
       x = "Year",
       y = "Number of New Awards") +
    theme_minimal()

})
})
in conclusion…